added 772 characters in body
Source Link

I am using 120 x one hour acoustic files ( according to "Guidelines for the use of acoustic indices in environmental research, https://doi.org/10.1111/2041-210X.13254) to describe my soundscapes using the maad.util.plot_features in python. This means I take the hourly average for my indices (ACI, NDSI, BI, Hf, ADI, AEI) over a day. Additionally I plot the mean spl in each 1000 Hz frequency domain from 0-22000 kHz, for each hour over a day, with

Can this method represent some characteristics (i.e the variations of selected indices ACI, NDSI, BI, Hf, ADI, AEI) for a day, by simply taking their mean value?

yes I described it wrong, what I actually wanted to say and what I actually do is that I use 120 hours (not minutes), or about 5 days of one minute continuous recordings (=5x24hr=120hr=7200min).

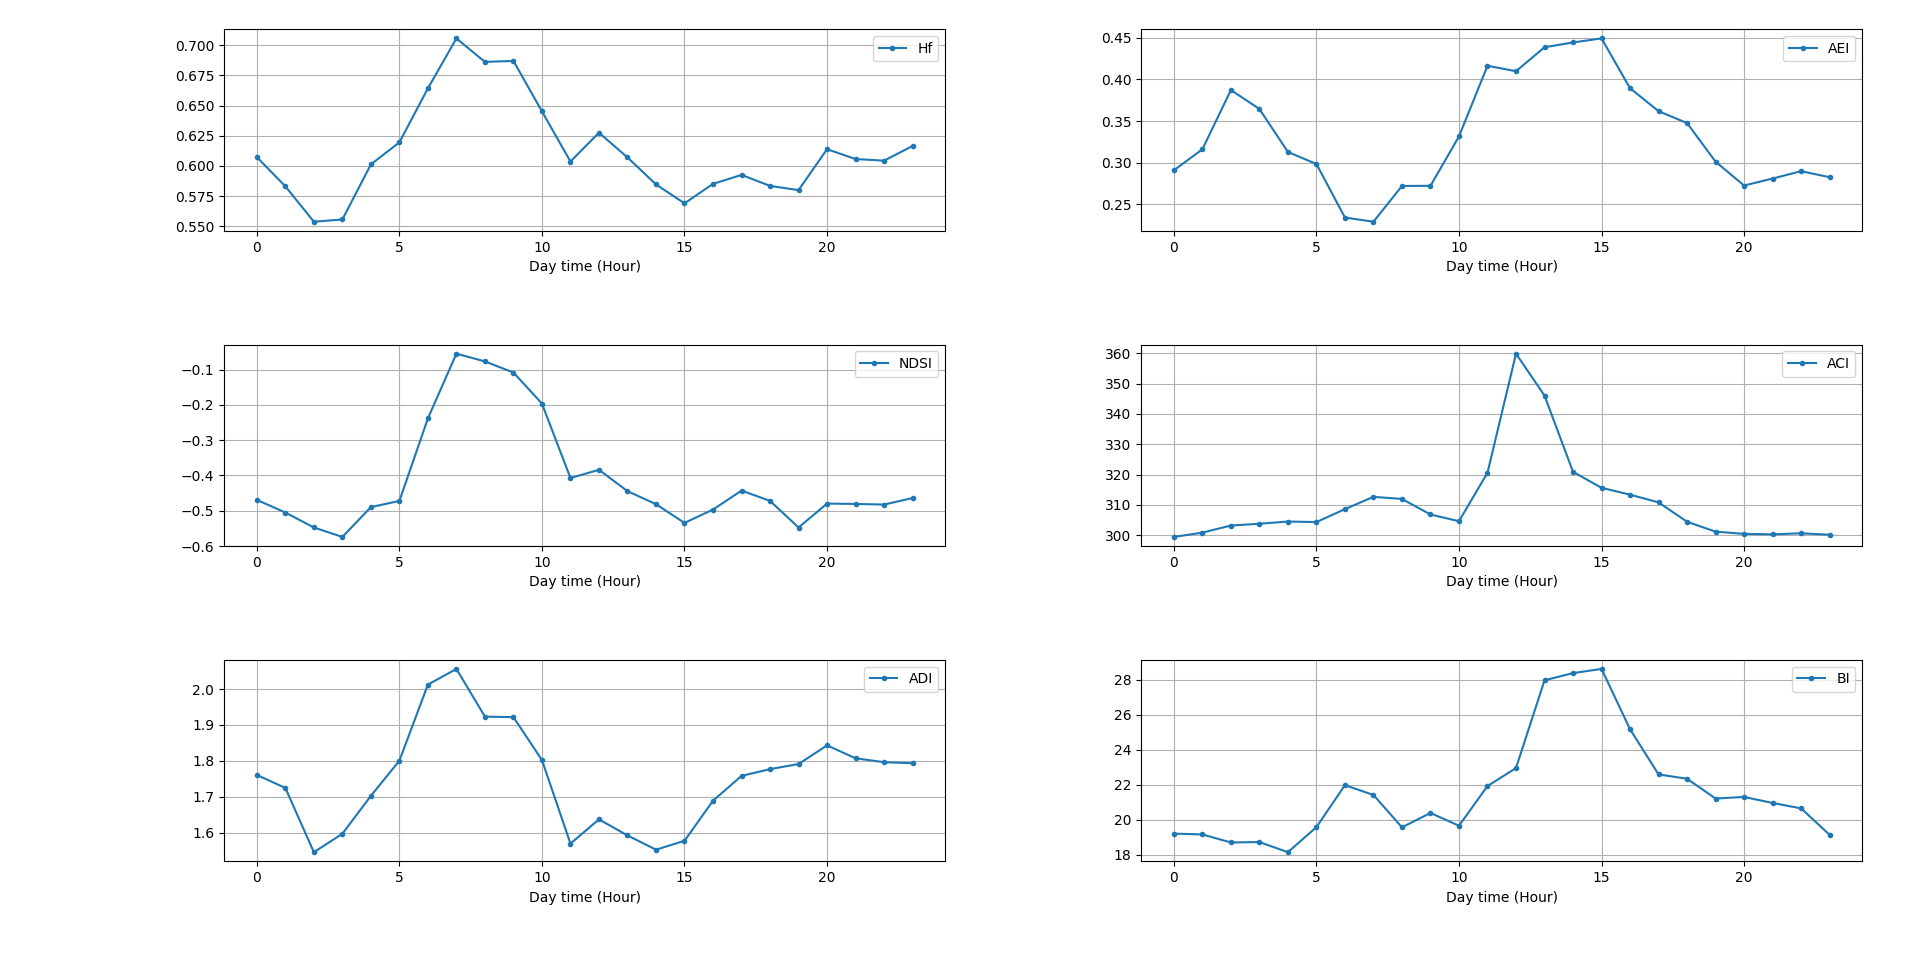
In order to find a motive of the daily sound variations of a soundscape , and describe it in a general way (in my case mixed cupressus/pine forests ) I resample the calculated indices on a daily average for every hour. This means the average hourly rate from all five days on a 24hr graph (I post a relevant graph). My question is if this method is sufficient or if there is another suggested methodology.

Regards,

enter image description here

Daily average of selected indices from 7200 minutes recording
I am using 120 x one hour acoustic files ( according to "Guidelines for the use of acoustic indices in environmental research, https://doi.org/10.1111/2041-210X.13254) to describe my soundscapes using the maad.util.plot_features in python. This means I take the hourly average for my indices (ACI, NDSI, BI, Hf, ADI, AEI) over a day. Additionally I plot the mean spl in each 1000 Hz frequency domain from 0-22000 kHz, for each hour over a day, with

Can this method represent some characteristics (i.e the variations of selected indices ACI, NDSI, BI, Hf, ADI, AEI) for a day, by simply taking their mean value?

yes I described it wrong, what I actually wanted to say and what I actually do is that I use 120 hours (not minutes), or about 5 days of one minute continuous recordings (=5x24hr=120hr=7200min).

In order to find a motive of the daily sound variations of a soundscape , and describe it in a general way (in my case mixed cupressus/pine forests ) I resample the calculated indices on a daily average for every hour. This means the average hourly rate from all five days on a 24hr graph (I post a relevant graph). My question is if this method is sufficient or if there is another suggested methodology.

Regards,

enter image description here

Daily average of selected indices from 7200 minutes recording

Fix innaccurate description of dataset (replace minutes with hours as per OP's comment)
Source Link

I am using 120120 x one minutehour acoustic files ( according to "Guidelines for the use of acoustic indices in environmental research, https://doi.org/10.1111/2041-210X.13254) to describe my soundscapes using the maad.util.plot_features in python. This means I take the hourly average for my indices (ACI, NDSI, BI, Hf, ADI, AEI) over a day. Additionally I plot the mean spl in each 1000 Hz frequency domain from 0-22000 kHz, for each hour over a day, with

Can this method represent some characteristics (i.e the variations of selected indices ACI, NDSI, BI, Hf, ADI, AEI) for a day, by simply taking their mean value?

I am using 120 x one minute acoustic files ( according to "Guidelines for the use of acoustic indices in environmental research, https://doi.org/10.1111/2041-210X.13254) to describe my soundscapes using the maad.util.plot_features in python. This means I take the hourly average for my indices (ACI, NDSI, BI, Hf, ADI, AEI) over a day. Additionally I plot the mean spl in each 1000 Hz frequency domain from 0-22000 kHz, for each hour over a day, with

Can this method represent some characteristics (i.e the variations of selected indices ACI, NDSI, BI, Hf, ADI, AEI) for a day, by simply taking their mean value?

I am using 120 x one hour acoustic files ( according to "Guidelines for the use of acoustic indices in environmental research, https://doi.org/10.1111/2041-210X.13254) to describe my soundscapes using the maad.util.plot_features in python. This means I take the hourly average for my indices (ACI, NDSI, BI, Hf, ADI, AEI) over a day. Additionally I plot the mean spl in each 1000 Hz frequency domain from 0-22000 kHz, for each hour over a day, with

Can this method represent some characteristics (i.e the variations of selected indices ACI, NDSI, BI, Hf, ADI, AEI) for a day, by simply taking their mean value?

fix typo in hyperlink
Source Link

I am using 120 x one minute acoustic files ( according to "Guidelines for the use of acoustic indices in environmental research, https://doi.org/10.1111/2041-210X.13254"https://doi.org/10.1111/2041-210X.13254) to describe my soundscapes using the maad.util.plot_features in python. This means I take the hourly average for my indices (ACI, NDSI, BI, Hf, ADI, AEI) over a day. Additionally I plot the mean spl in each 1000 Hz frequency domain from 0-22000 kHz, for each hour over a day, with

Can this method represent some characteristics (i.e the variations of selected indices ACI, NDSI, BI, Hf, ADI, AEI) for a day, by simply taking their mean value?

I am using 120 x one minute acoustic files ( according to "Guidelines for the use of acoustic indices in environmental research, https://doi.org/10.1111/2041-210X.13254") to describe my soundscapes using the maad.util.plot_features in python. This means I take the hourly average for my indices (ACI, NDSI, BI, Hf, ADI, AEI) over a day. Additionally I plot the mean spl in each 1000 Hz frequency domain from 0-22000 kHz, for each hour over a day, with

Can this method represent some characteristics (i.e the variations of selected indices ACI, NDSI, BI, Hf, ADI, AEI) for a day, by simply taking their mean value?

I am using 120 x one minute acoustic files ( according to "Guidelines for the use of acoustic indices in environmental research, https://doi.org/10.1111/2041-210X.13254) to describe my soundscapes using the maad.util.plot_features in python. This means I take the hourly average for my indices (ACI, NDSI, BI, Hf, ADI, AEI) over a day. Additionally I plot the mean spl in each 1000 Hz frequency domain from 0-22000 kHz, for each hour over a day, with

Can this method represent some characteristics (i.e the variations of selected indices ACI, NDSI, BI, Hf, ADI, AEI) for a day, by simply taking their mean value?

Source Link
Loading