Short answer
Set the Datagram bin size to be the full duration of the duty cycle. For example, if the duty cycle is 1 min recording every 10 minutes, then set the Datagram bin size to 600 s.
Longer answer and background info:
If I understand you correctly, the functionality that you seek is to view summaries of analysis produced by PAMGuard modules for your 1-minute long recordings, but you want to view these without any gaps or whitespace (or gray-space) in between recordings (e.g. during the 9 minutes of non-recorded data).
As far as I'm aware, the option to skip whitespace does not exist as an explicit feature within the current functionality of PAMGuard's data map. However, I think there may be a couple of ways to wrangle the settings to get the desired effect, or to work around the limitations of the data map.
First, I think it's important to understand that the Data Map is really intended to provide a high-level summary of the output of PAMGuard modules over time. It is not really intended to be used to search for signals, so your use-case is a bit beyond what it is intended for. That said, I myself have found the PAMGuard data map surprisingly effective for browsing long-term spectral averages for times with interesting spectral content.
On the data map the x-axis is always date and time. Each panel of the data map shows the output only of a single PAMGuard module, and this output is summarised into user-defined time periods (by default 600 s). Some modules only show the number of data units per time period (e.g. the Sound Acquisition Module will show the number of recording sessions or files per time period). Other modules can display an image (column/rectangular slice) of coloured pixels for each time period. You can change the default time period for each summary in Viewer mode via:
File -> Binary Store -> Datagram options
If I understand correctly, setting the datagram duration to that of your duty cycle (10 minutes as stated in your original post) should create a continuous LTSA for you with no whitespace. Other modules might behave differently though.
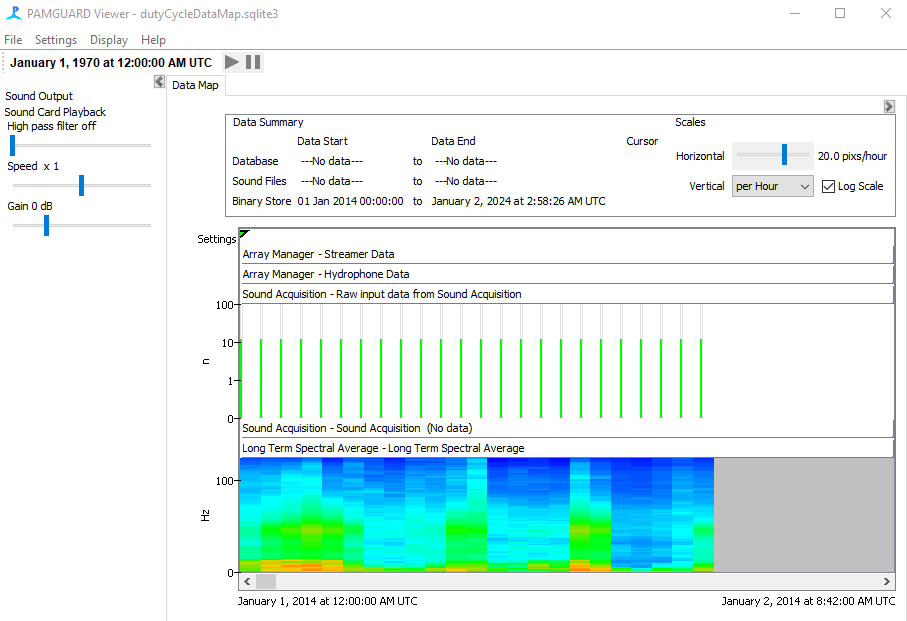
Here are two example screenshots showing the exact same dataset, but each screenshot uses a different Datagram bin size. The data are from the open-access SORP Blue and Fin Whale Annotated Library, specifically from the duty-cycled Elephant Island 2014 recordings. These recordings have a duty cycle of 5 min every hour. The first screenshot shows Datagram bin size of 600 s. The second screenshot shows Datagram bin size of 3600 s.


Here you can see that the LTSA module indeed expanded the images to fill the full 3600 s, whereas the Sound Acquisition module behaves differently (and incorrectly). In this example, using PAMGuard version 2.02.09, it seems that the Sound Acquisition is hard-coded to use the start and stop times of each file as the time period, and that these are then scaled by the selection of the 'Vertical' drop-down. In my example, this results in the incorrect suggestion that there are 10-12 wav-files per hour (hard to tell on the log-scale) when in fact there is only one. As such, this should probably be filed as a bug in PAMGuard.
Another potential workaround to achieve your goal would be to use the PAMGuard Matlab or PAMGuard R libraries to load your data in in Matlab or R (https://www.pamguard.org/48_MATLABRcode.html) and then create data summaries that are similar to the data map. There's a detailed post/how-to with some extra Matlab code that might help you achieve this for LTSA module in Matlab (https://jamieslabs.wordpress.com/2018/03/04/updated-ltsa-code/). While this approach is potentially more complicated, it is also a lot more flexible and customisable in terms of the look and feel of the resulting output.
Anyway, thanks for your question, and I hope this helps.


