The power spectral density (PSD) of the signal describes the power present in the signal as a function of frequency, per unit frequency.
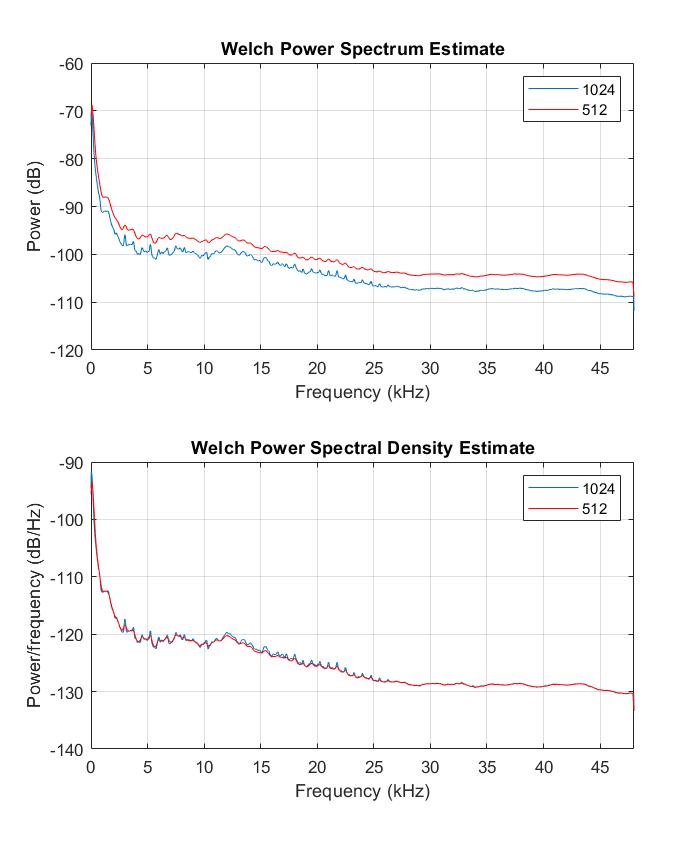
So, the answer is NO, while the spectral power estimate will change with FFT window size, the PSD (W/Hz) will always be scaled to 1 Hz bandwidth. Larger FFT window sizes will give you more spectral details than smaller ones that are smoother, but the values should give you power in 1Hz Bandwidth.
Edit: To avoid some mis-interpretation, here some Matlab experiment with some data I'm just working on
figure(1)
subplot(211)
hold off
pwelch(xx(:,2),hann(1024),512,4096,fs,'power')
hold on,
pwelch(xx(:,2),hann(512),256,1024,fs,'power')
hc=get(gca,'children');
set(hc(1),'color','r')
legend('1024','512')
subplot(212)
hold off
pwelch(xx(:,2),hann(1024),512,4096,fs,'PSD')
hold on,
pwelch(xx(:,2),hann(512),256,1024,fs,'PSD')
hc=get(gca,'children');
set(hc(1),'color','r')
legend('1024','512')
which generates

Top: Power Spectrum estimate, Bottom: Power Spectral Density estimate
Hope this helps: Yes, in the power estimate is for longer FFT windows less power in the frequency bin, but for the spectral density estimate the values are equal
