20
$\begingroup$

I know that as FFT size is increased, spectral (frequency) resolution increases and temporal resolution decreases (and vice versa when FFT size is decreased).

According to: (Frequency Resolution) = (Sampling rate) / (# FFTs)

However, I am uncertain about how this relationship affects the PSD (power spectral density). Does the accuracy of a PSD change with FFT size, and if so, does it do so in the same manner?

$\endgroup$

4 Answers 4

15
$\begingroup$

Short answer: the choice of FFT length will affect how many points your Power Spectral Density (PSD) estimate will have in the frequency domain (and thus its ability to show small details, i.e. its "smoothness"), and it will change how many averages are performed in the PSD estimate calculation (and thus how well it "averages out" noise in the recording).

Long answer: as WMXZ's answer points out and demonstrates, the "true" Power Spectral Density of a signal should not change with different FFT lengths. However, in practice:

  • We can only perform an estimate of the "true" signal PSD from an imperfect, noisy recording, and the FFT length has an effect on the robustness of your PSD estimate to noise.
  • For any FFT-based method, using N_fft points in the time-domain results in a spectral estimate with N_fft points in the frequency domain, starting at frequency f=0 and ending just short of f=fs (sampling frequency). A higher N_fft then results in a more detailed / less smooth spectral estimate.

Assuming the conventional Welch's method for calculating the PSD and ignoring overlap (so technically a Bartlett estimator, but the idea is the same), the process is approximately as:

  • Break your signal into non-overlapping frames (i.e. "chunks") of N_fft samples (here it is assumed your actual signal recording is much longer than N_fft). For example, for a signal with 1000 samples and N_fft=100, your chunks will be n=0..99, n=100..199, ..., n=900...999.
  • Run a FFT on each frame separately (plus some weighting constants) to estimate the PSD of the signal (+noise) within that frame.
  • Average the multiple estimates, so the "true signal" spectral features that show up identically in all frames remain the same, but the noise that shows up incoherently in each spectral estimate is averaged out (or at least attenuated).

Therefore, for a fixed duration of your recorded signal, longer FFT lengths will yield narrower frequency resolution but result in less averages, leading to a more detailed but noisier estimate. On the other hand, shorter FFT lengths will result in coarser frequency resolution but lead to more averages, resulting in a less-detailed, but hopefully less noisy spectral estimate. A trade-off can generally be found via trial and error.

There are plenty of other factors involved (overlap, windowing function, zero-padding, etc), but as far as I know that's the main tradeoff in choosing a FFT size for your PSD calculation.


Some great references for a more in-depth discussion of spectral estimates are:


EDIT: edited to comment on WMXZ's answer below.

$\endgroup$
1
  • 1
    $\begingroup$ Answer is correct for Power spectrum, but IMHO not for Power spectral Density (PSD) as questioned in OP. See my answer. $\endgroup$
    – WMXZ
    Commented Jul 21, 2022 at 4:26
12
$\begingroup$

The power spectral density (PSD) of the signal describes the power present in the signal as a function of frequency, per unit frequency.

So, the answer is NO, while the spectral power estimate will change with FFT window size, the PSD (W/Hz) will always be scaled to 1 Hz bandwidth. Larger FFT window sizes will give you more spectral details than smaller ones that are smoother, but the values should give you power in 1Hz Bandwidth.

Edit: To avoid some mis-interpretation, here some Matlab experiment with some data I'm just working on

figure(1)
subplot(211)
hold off
pwelch(xx(:,2),hann(1024),512,4096,fs,'power')
hold on,
pwelch(xx(:,2),hann(512),256,1024,fs,'power')
hc=get(gca,'children');
set(hc(1),'color','r')
legend('1024','512')
subplot(212)
hold off
pwelch(xx(:,2),hann(1024),512,4096,fs,'PSD')
hold on,
pwelch(xx(:,2),hann(512),256,1024,fs,'PSD')
hc=get(gca,'children');
set(hc(1),'color','r')
legend('1024','512')

which generates enter image description here
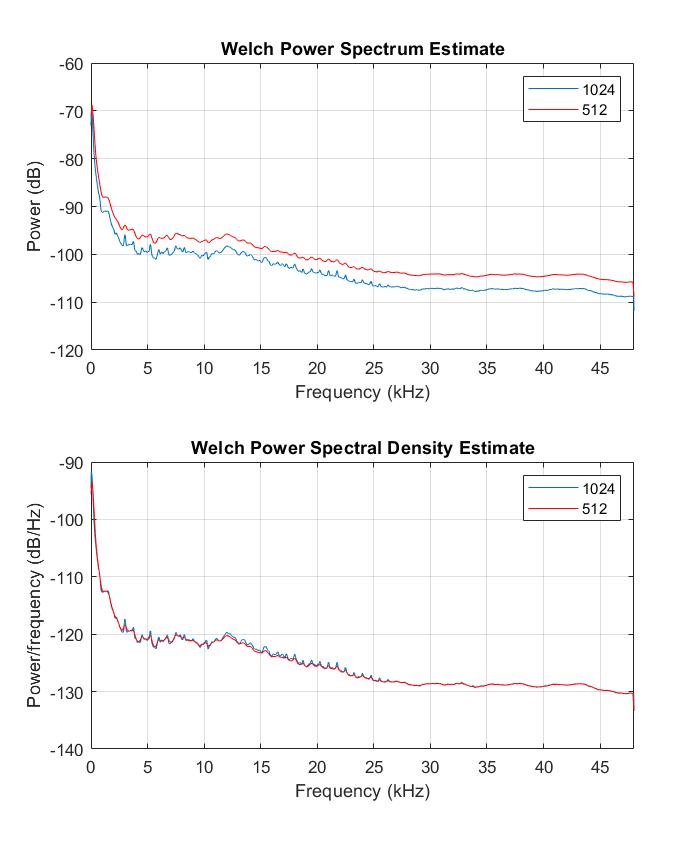
Top: Power Spectrum estimate, Bottom: Power Spectral Density estimate

Hope this helps: Yes, in the power estimate is for longer FFT windows less power in the frequency bin, but for the spectral density estimate the values are equal

$\endgroup$
2
  • 1
    $\begingroup$ This definition of PSD as the power per 1 Hz bandwidth is correct, but actual computations using Welch's method will wield an estimate of the power within each frequency bin of width df = fs/N_fft, which can be narrower or wider than 1 Hz. Say, for fs=48000 Hz and N_fft=1024 points the Welch's method will give the power inside each bin of width df = 46.8 Hz. I'm not sure how to best describe the difference between these two quantities though; perhaps calling them "PSD" and "PSD estimate"? $\endgroup$ Commented Jul 20, 2022 at 16:01
  • $\begingroup$ Thank you for the Matlab example, it does clarify your point about the differences between the PS and the PSD! I think we are in agreement about trading frequency resolution (i.e. spectral details) vs. noise in the estimates (i.e. smoothness) by changing the FFT length (and thus number of averages). I will edit my answer to reflect your point too. $\endgroup$ Commented Jul 21, 2022 at 9:18
4
$\begingroup$

It depends on what you mean by 'accuracy.' The FFT length as such does not help much in answering the question. When I teach spectral analysis to my students at the Indian Institute of Technology Madras, this is what I tell the students.

  1. The sampling frequency should be twice or more than twice the highest frequency in the signal. If you do not follow this rule, you will get aliasing, no matter what your FFT length is.

  2. The frequency resolution (Hz) = 1/Time_length (s) of the signal that you input. Yes this relationship can also be written in terms of the FFT length and the sampling frequency. But the frequency resolution depends on the time length of the signal, and that is that.

  3. Increasing the FFT length (via zero padding), will get you a smooth-looking PSD. There is some interpolation that happens here, but no extra details get added when you increase the length of the FFT (via zero padding). My grad school advisor from George Mason University used to say in class 'If you get extra frequency resolution via zero padding, then I have a beach property for sale'

  4. If your FFT length is less than the number of samples in the signal, then the FFT algorithm (in Matlab) will just truncate your signal. So you could potentially lose information.

  5. If you want to find out the dominant frequencies in a signal, the FFT length should also take into account the time-coherence of the signal. If the FFT length is greater than the length of time over which the signal is stationary (example... frequencies do not change) then you will again get inaccurate answers.

$\endgroup$
1
$\begingroup$

To make it clear, one should also look at a signal of a specific frequency (pure tone signal). The PSD is then an infinite narrow, but infinite high peak (a delta function with the integral yielding the power of the signal). The "PSD estimate" is a smeared out function of this delta function. But as narrower the bins, as higher and narrower the peak (while keeping the area under it). On the other side, the power spectrum will always show a peak with a height corresponding to the power of the signal, independent of how narrow the bin is.
In conclusion: In PSD, the noise levels will not change when changing the bin size as illustrated by @WMXZ, but the peak of a single tone signal will increase with decreasing bin size. In a Power Spectrum (PS), the peak of a single tone signal will not change with decreasing bin size, but the noise levels will decrease (see answer from @WMXZ). This is important to note when discussing Signal-to-Noise ratio by just looking at a spectrum (either PSD or PS). It often leads to confusions. I am not sure this answers the original question. But the time-frequency uncertainty holds independent of computing power or power densities.

$\endgroup$

Your Answer

By clicking “Post Your Answer”, you agree to our terms of service and acknowledge you have read our privacy policy.

Not the answer you're looking for? Browse other questions tagged or ask your own question.