3
$\begingroup$

I am working with underwater background noise/ambient noise in the eastern Atlantic Ocean using the package PAMGuide for R. My study has 32 sampling stations and it was conducted during 6 campaigns (summer 2021 to winter 2024) sampling in the same stations.

The process to obtain this background noise through the PAMGuide package was as follows:

  • First I extract from the entire record (~10 minutes) the most silent minute (no presence of human activities, if possible)
  • Then I upload that minute to R with the PAMGuide package, and the sound file is analysed with the following settings - Analysis type: Broadband; Window type: Hann; Window length: 1 sec; Window overlap: 50%; Frequency limits: 100 Hz – 40000 Hz; Calibration data: In water, End-to-end, -176 dB. The calibration data is taken from the hydrophone calibration values, indicated by the manufacturer.
  • The value that was decided to represent the background noise for this study was the median

During the analysis of the last campaign, I obtained 4 values of background noise that are really low (under 60 dB) you can find a table with the values obtained during that day of sampling. It should not be a matter of calibration, because if that were the case then all the values of the campaign should be equally affected, not some values in the same day "weird" and some "normal", as it can be seen in the table. Also, when you listen to the records they present a lot of noise in it.

Sampling Station Background Noise (dB)
S1 50.8
S2 63.7
S3 59.8
S4 94.9
S5 91.8
S5A 60
S5B 87.7
S6 83.8

So if anyone can give me a hand or have any idea what's been going on here, that would be amazing!

Thank you in advance!

You can see below different welch periodograms, first one are the records from the same day that have "normal" values of background noise; the next periodograms are the records with "low" values of background noise, and the last one is an example of a welch periodogram with presence of human activity (continuous boat engine)
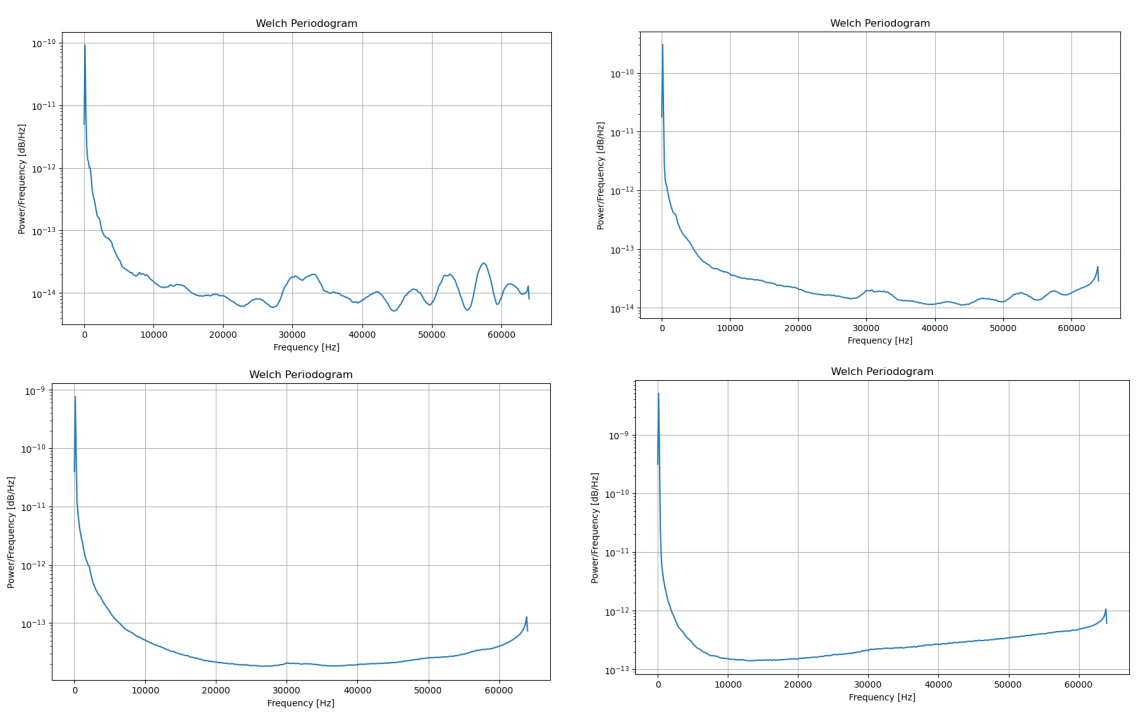
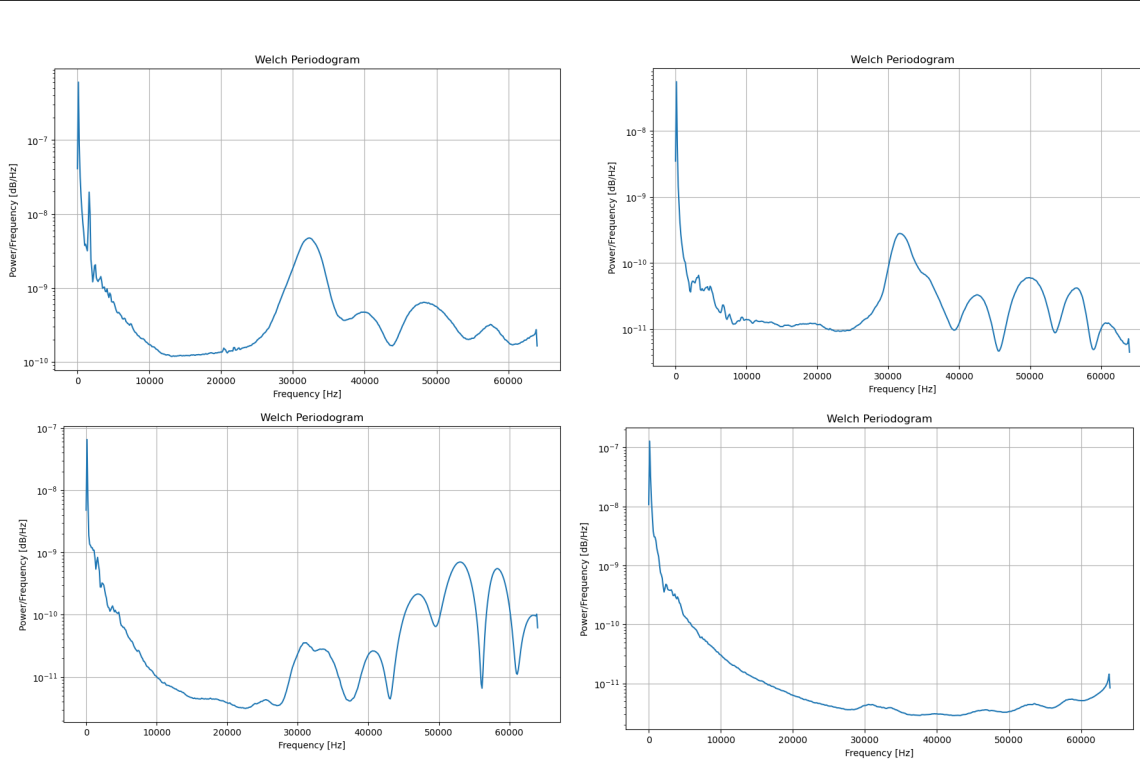
welch periodograms of records with normal values welch periodograms of records with low values

welch periodogram with human activities

$\endgroup$
5
  • $\begingroup$ Could you provide a welch type periodogram (preferable with logarithmic frequency scale) of the files in questions? $\endgroup$
    – WMXZ
    Commented May 20 at 15:54
  • $\begingroup$ Hello @WMXZ, I have add to the question the welch periodogram of the 4 tracks with low values of background noise. Thank you in advance!!! $\endgroup$
    – Ana Sanz
    Commented May 20 at 19:07
  • $\begingroup$ Thanks for periodogram. Could you please add one from the other sites for comparison and one with human activity in? Also, which recorder did you use? $\endgroup$
    – WMXZ
    Commented May 21 at 5:26
  • $\begingroup$ @WMXZ I have added those periodograms also to the question, I hope they help. It was icListen hydrophone $\endgroup$
    – Ana Sanz
    Commented May 21 at 8:27
  • $\begingroup$ I still have another question: I guess, you plotted Power in log scale (the axis label (dB)is misleading), right? so we have -90 to -140 dB. 2nd: did you apply gain setting to icListen, or used the 24bit regime? $\endgroup$
    – WMXZ
    Commented May 21 at 15:06

2 Answers 2

1
$\begingroup$

after comparing my results, which were obtained by PAMGuide in R, and the ones obtained by PAMGuide in Matlab with the same tracks; we saw that it seems to be an issue leading to differences between PAMGuide's R and MATLAB implementations. It has to do with calibration and sensitivity, but we are not getting it just yet because for R the same code was used for all the tracks analysed during the 6 campaigns.

$\endgroup$
0
$\begingroup$

Inspecting the Spectra and assuming the last one to be an expected one (ambient+ship), one notes that the overall tendency (LF peak and HF curve) are similar and only the ship noise may be recognized (would be clearer if frequency were plotted in log scale).

The so-called "low noise" plots are however much noisier than the "normal" plots, by about 20 to 30 dB (both in LF peak and HF curve). Also three of them have significant HF noise (>20 kHz) that, could easily be explained by plastic hitting the hydrophone. It is not clear how these spectra (data) result in 20-30 dB lower level estimates as given in OP, except that the noise level estimate has somewhere the wrong sign.

$\endgroup$
1
  • $\begingroup$ Thank you for your answer! Really appreciate it! $\endgroup$
    – Ana Sanz
    Commented May 24 at 8:00

Your Answer

By clicking “Post Your Answer”, you agree to our terms of service and acknowledge you have read our privacy policy.

Not the answer you're looking for? Browse other questions tagged or ask your own question.