7
$\begingroup$

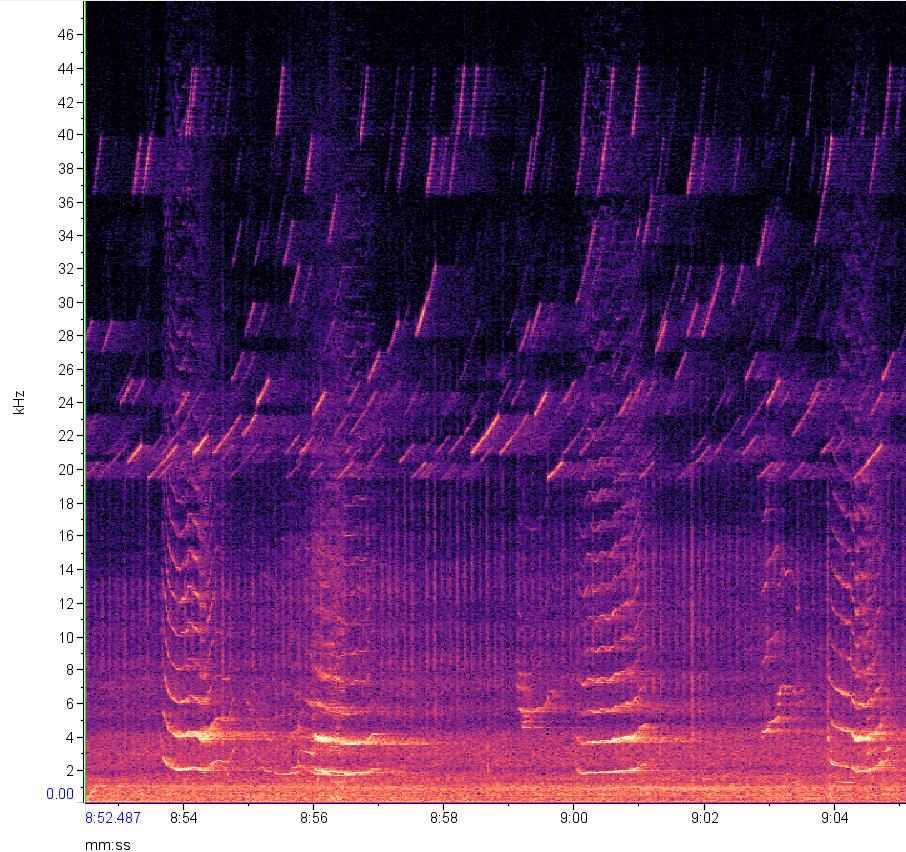
In a recording from January 2023 in northern Norway (Skjervoy), I found a strange signal, that consist of upsweeps between 20-45 kHz (see spectrogram). We were recording humpback whales in the night and had two boats passing a few kilometers away. One of the boat had a typical Sonar at 50 kHz (not shown in the spectrogram). I think this could be a different sonar or an underwater modem for communication. Does anyone recognize these signals or can give any information what it could be?

edit for data availability:
dataset is published under DOI
timestamp: 2023-01-04T18:55:00Z
1 min. wav snipped: 2023-01-04--18-55-00--00-01-00.wav

Spectrogram showing humpback vocalizations and the signal of question

$\endgroup$
7
  • $\begingroup$ Could it be subs? $\endgroup$ Commented Jan 23, 2023 at 21:44
  • 3
    $\begingroup$ Can you update your title to be more specific (help attract potential answers!), and if you can provide a link to the sound (perhaps on soundcloud). This would be helpful- thanks! $\endgroup$
    – Shannon
    Commented Jan 24, 2023 at 0:21
  • 3
    $\begingroup$ A sound file would be useful to allow different visualizations $\endgroup$
    – WMXZ
    Commented Jan 24, 2023 at 7:07
  • $\begingroup$ @Mad Physicist: doubt it is a sub. they 'survive' only if not making sound. $\endgroup$
    – WMXZ
    Commented Jan 24, 2023 at 7:09
  • 1
    $\begingroup$ @JörgRychen Perhaps "What are these high frequency (>20kHz) upsweep apparent man-made signals" ... Something like that? Goal is to help others who seek the same information in the future. Since this appears to be manmade, the location is less relevant in the subject title (might be for biological sounds). Basically, identifying that it is high frequency, upsweep, possible manmade would be helpful?!?! Thanks!! $\endgroup$
    – Shannon
    Commented Mar 22, 2023 at 13:52

3 Answers 3

5
$\begingroup$

I don't have experience with sonar or marine communication systems but:

The highly-regular shape with very strong cutoffs at unchanging frequencies certainly indicates it's an artificial source. I would also take it as a clue that the lowest frequency is 20 kHz, and there's nothing below that: many human-built systems are designed to be "ultrasonic" on the assumption that many humans can't hear sounds above approx 20 kHz. (Note that the 20 kHz limit is a heuristic: many children can hear sounds higher than that!)

The curves you see on the spectrogram (although I haven't measured them) look like quadratic chirp signals. Frequency-modulated (chirp) signals have good properties of robustness to noise and to multiple reflections etc, which means they are sometimes used in communications systems. The pattern of chirps also seems to be encoding something, rather than being a fixed repetitive signal as might be used in sonar range-finding.

For a technical example in (human) communications tech, see Springer et al (2000) Spread spectrum communications using chirp signals EUROCOMM 2000. Information Systems for Enhanced Public Safety and Security. IEEE/AFCEA, 2000, 166-170

Can anyone add more specific detail about the spectrogram, e.g. what the system is likely to be for?

$\endgroup$
1
3
$\begingroup$

From spectrogram one can deduce that in addition to being man made,

  • it is for short range (attenuation of 40 kHz signals in water is 10dB/km)
  • there are 15-16 distinct bands of independent signals (no harmonics)
  • waveforms indicate constant Time-Bandwidth (and constant Q) transmissions aiming at constant signal processing gain
  • individual sweeps show volume reverberation, so it is generated at some distance
  • no clear multi-path is visible, so signal was most likely generated close to surface or sensor was close to surface

Without a more comprehensive dataset and recoding context it is difficult to speculate on origin and purpose.

Edit on processing gain: It seems to me that upsweeps at lower frequencies that have narrower bandwidth are also somewhat longer that the signals at higher frequencies that have larger bandwidth. If the receiver is match-filtering then the processing gain is determined by the product of duration and bandwidth (time-bandwidth product), which could be close to constant. The increase of bandwidth with frequencies would also indicate a constant Q filtering. Obviously, a more detailed analysis would be facilitated with access to the timeseries. Definitely, a very interesting signal (and in case it was a joke made to you by some technicians it is a very intelligent one).

Edit on multi-path: There are double signals that could be confused with multi-path. However, as they time separation corresponds to the duration of the sweep, it is very unlikely that they are multiple arrivals. More likely they are part of the code. Only reprocessing of the time series with proper matched filters would reveal the medium transfer function (multi-path structure)
$\endgroup$
3
  • $\begingroup$ const. Q would hint at exponential curves, but answer 1 suggested quadratic curves. Could you explain the argument with the const signal processing gain further? $\endgroup$ Commented Jan 24, 2023 at 21:23
  • $\begingroup$ I do see sweeps that have a clear 2nd and 3rd path. To me it looks like there are different emitters, and some have multipath and some have "volume" reverberation. $\endgroup$ Commented Jan 24, 2023 at 21:28
  • $\begingroup$ I agree, speculation is difficult, unless someone recognizes the signals and can tell us what device it is and how it is used. $\endgroup$ Commented Jan 24, 2023 at 21:30
0
$\begingroup$

A Thermocline with a Soft Bottom.

$\endgroup$
1
  • 3
    $\begingroup$ Hi @user1243 -- thanks for the answer. It could possibly be useful, but could you expand it so that a reader can understand your explanation? $\endgroup$
    – Dan Stowell
    Commented Jan 24, 2023 at 12:13

Your Answer

By clicking “Post Your Answer”, you agree to our terms of service and acknowledge you have read our privacy policy.

Not the answer you're looking for? Browse other questions tagged or ask your own question.