4
$\begingroup$

I'm using PAMGuard to detect killer whale stereotyped calls from hydrophone recordings from Puget Sound, and now I've figured out a general system for exporting the database of Whistle and Moan Detector returns from PAMGuard to SQLite Studio to Microsoft Excel. Now the issue is that I'm unclear on what some of the column names in the returned database mean for the detections. This is likely pretty straightforward, but I'm very new to using PAMGuard for something like this. I couldn't find a legend from the PAMGuard site or literature, and I don't have anyone else working on the project who I can conclusively clarify this with.

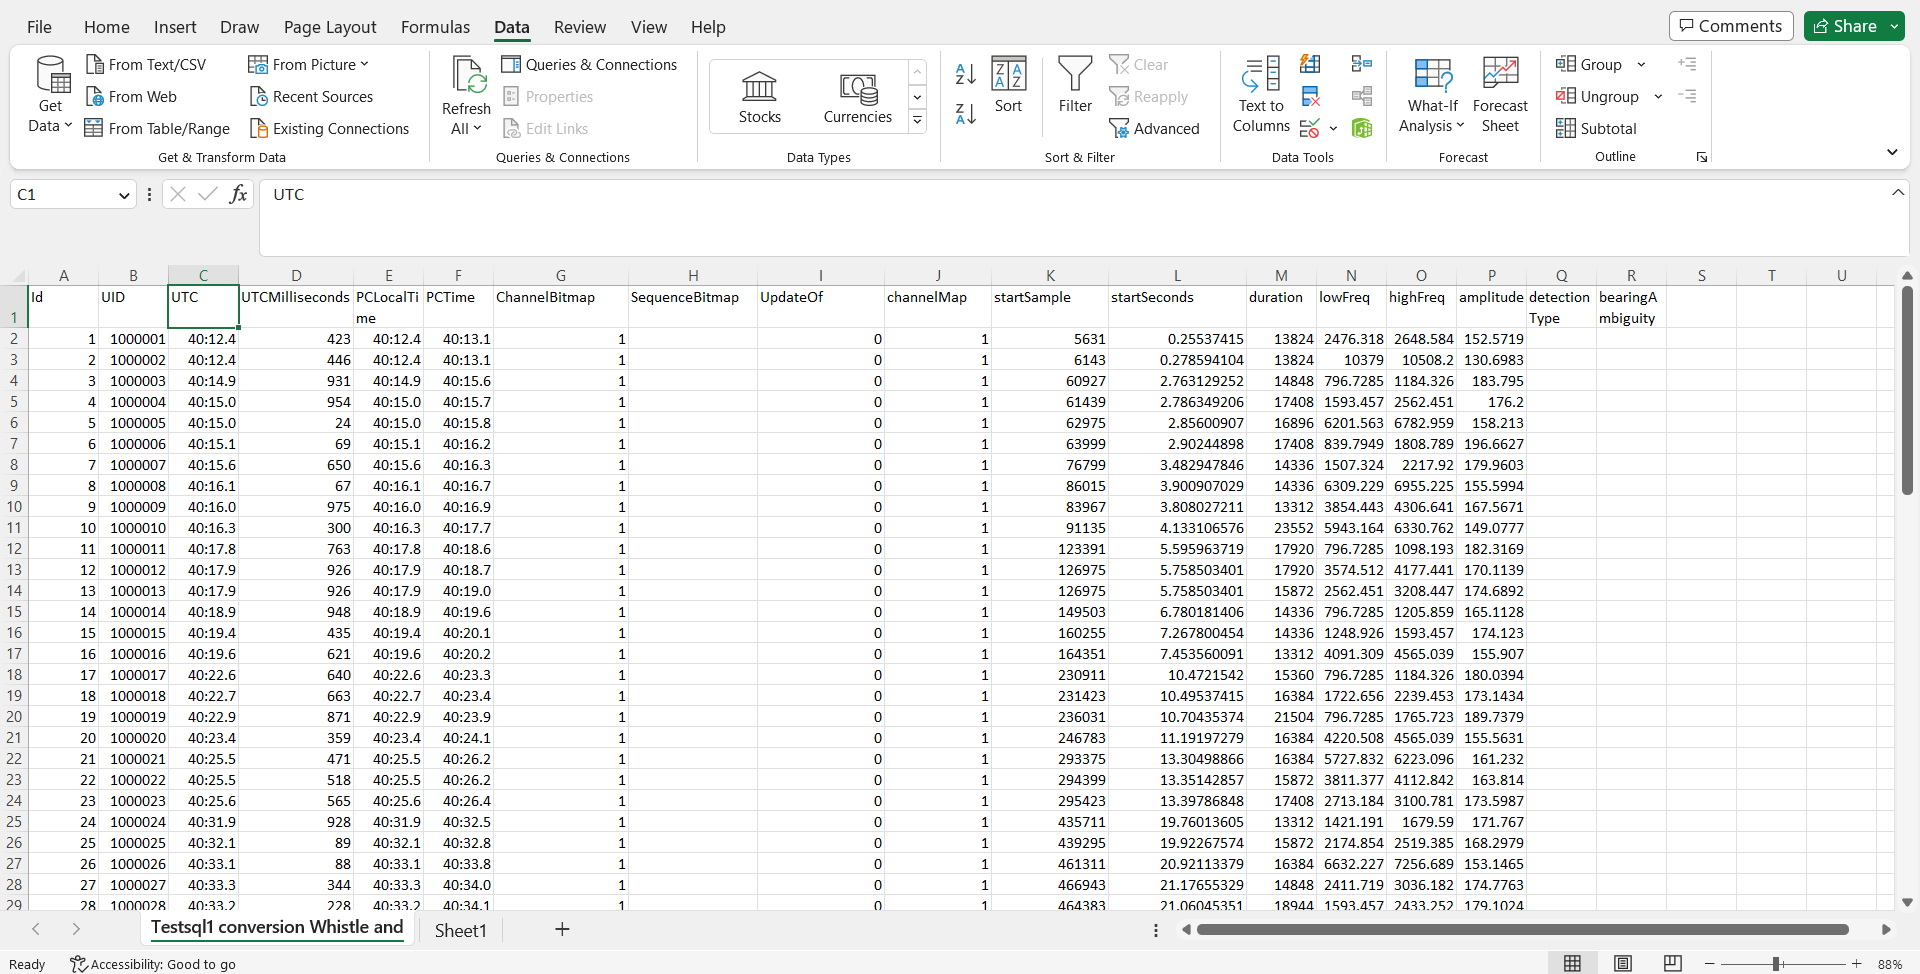
Screenshot of Microsoft Excel page showing a large chart of detections data originally from PAMGuard's Whistle and Moan Detector

startSample: I'm just not sure what this means, period.

duration: I'm confused on what the units for this are in the PAMGuard database, since either seconds or milliseconds would be far too long for the relevant detections (which are a few seconds each, at most).

amplitude: Would this just be the average amplitude of the detected signal?

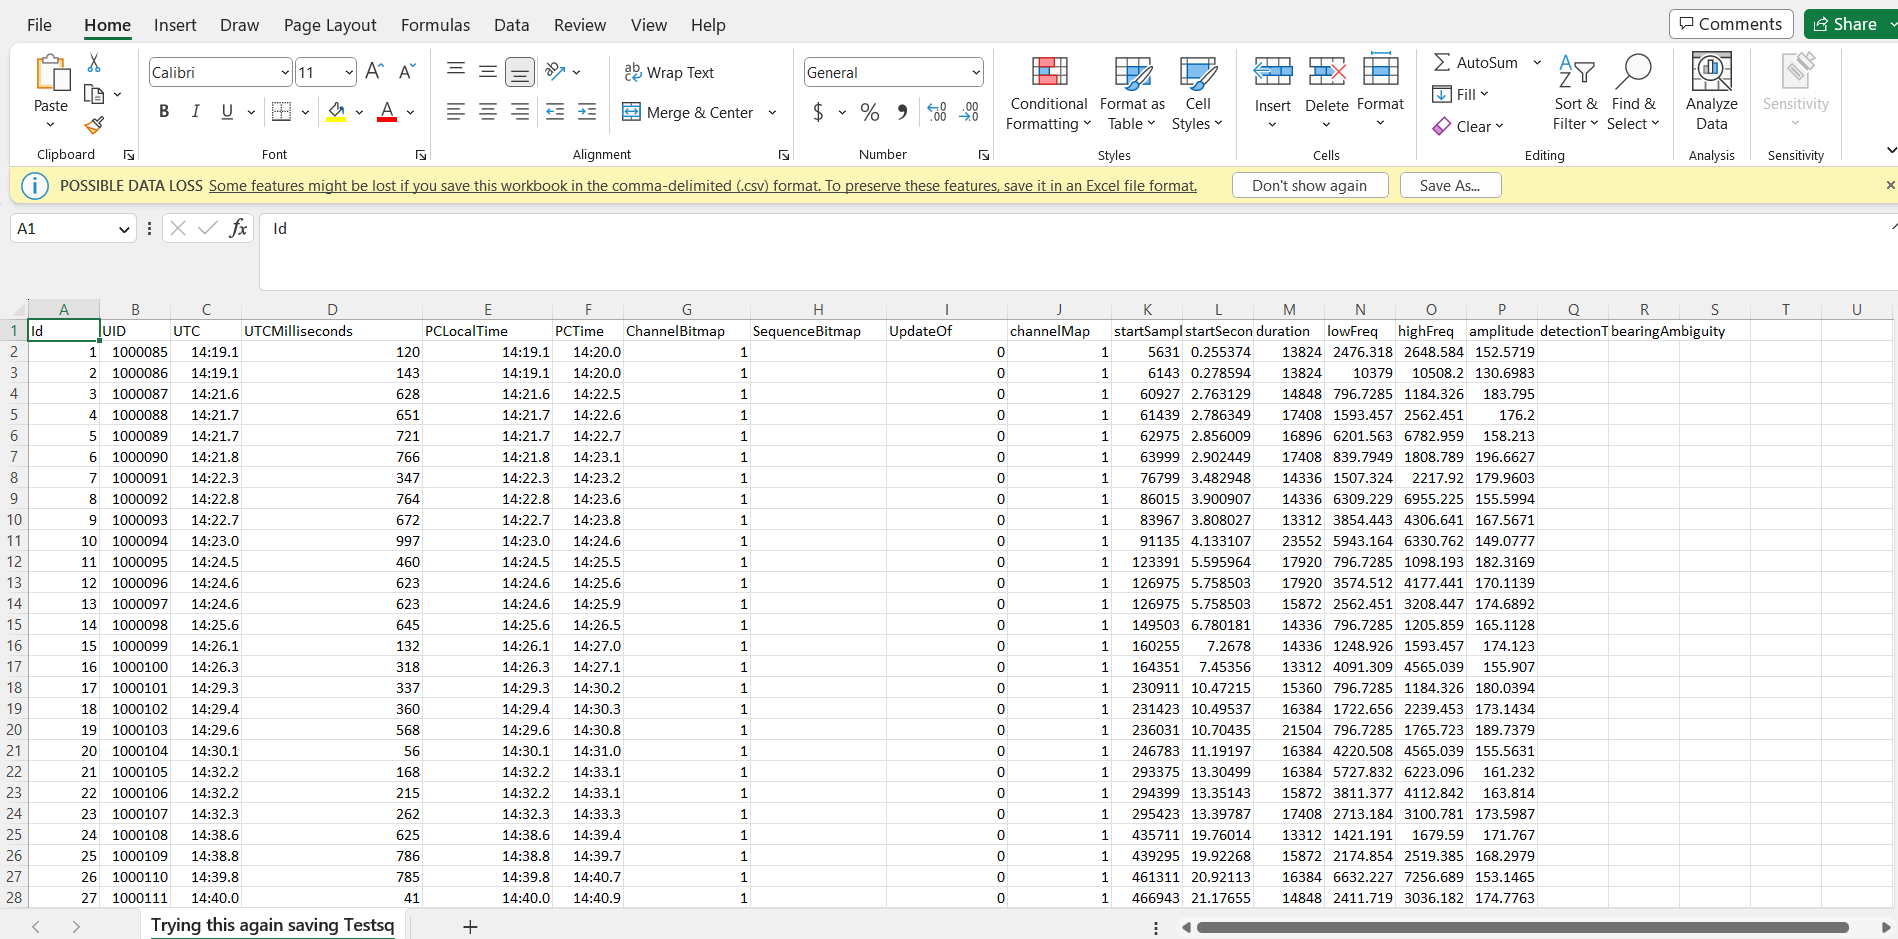
UTC and UTCMilliseconds: I understand that these refer to the Universal Coordinated Timezone, but what confuses me is if they'd be able to be converted to local time to see what time a signal (that wound up detected in PAMGuard) was made as the hydrophone was recording out in the field. If the timestamps are objectively tied to when the recording was being made, then I don't see how to explain the following: I used the same audio file and detector settings, ran the Whistle and Moan Detector on it again, and saved the resulting detections to a new database file so that I could check that the storage path was working correctly. I wound up opening this new file in Excel after saving it as a CSV file in the same way as the first database, and expected all the values to be the same because PAMGuard had been run on the same audio file and the detections should be identical. The screenshot above is from the first database, and the screenshot below is from the second database collected for the same audio file.
The only values that weren't the same between the files were the UTC, UTCMilliseconds, UID, and PC time values. Is it the case that the UTC time values actually tied to when the files are processed in PAMGuard on my computer, rather than the time of recording in the field?

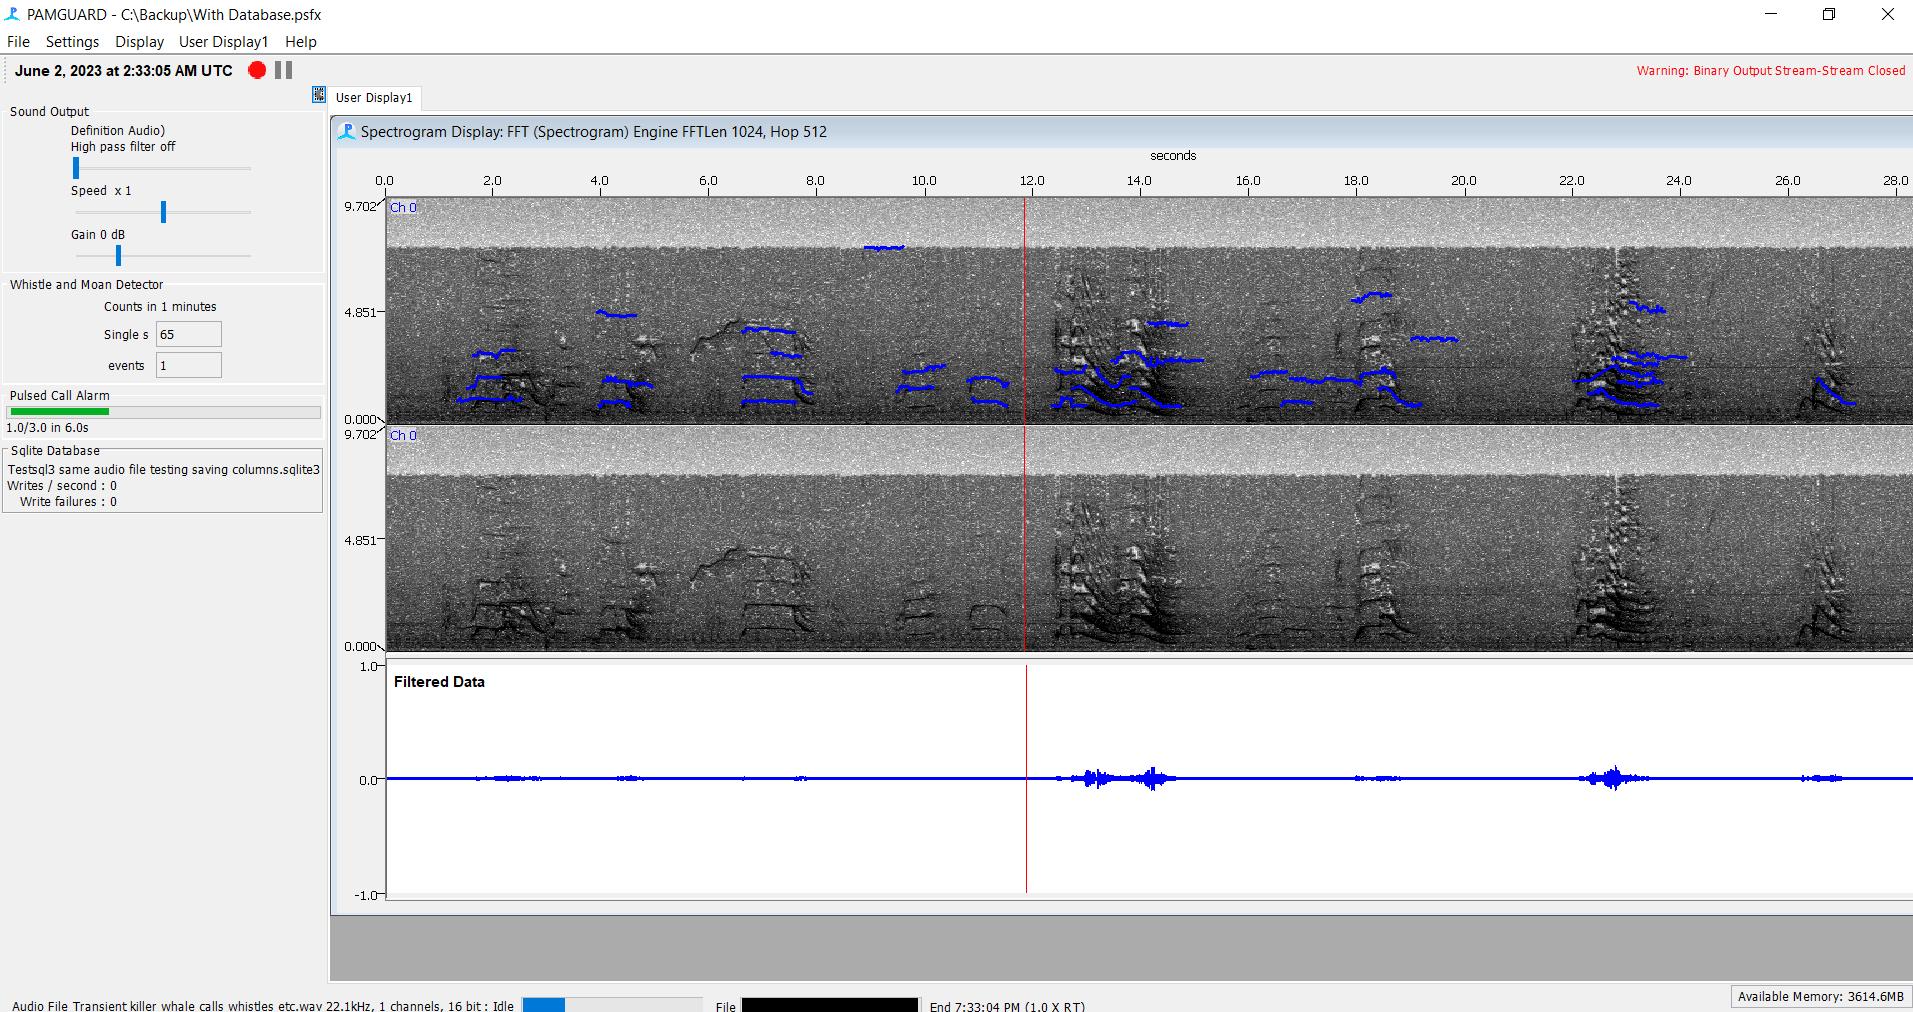
If helpful, this is a screenshot of the spectrogram view of the recording in PAMGuard after the Whistle and Moan Detector has been run. All of the detected vocalizations look similar to this, it's a pretty short audio file.
Thank you,
$\endgroup$

3 Answers 3

3
$\begingroup$

It's been a while since I've contributed to Pamguard, but here's my attempt to answer this question.

startSample: For each detection this is the number of digital samples that have passed since the start of the data acquisition. If your acoustic recording starts at the same time as the data acquisition, then it is also the number of samples in your recording (noting that Pamguard can acquire data without recording).

duration: the units are in digital samples. You would need to divide by the sample rate of your acquisition if you wanted to convert into seconds or milliseconds.

UTC: this is indeed a date and timestamp in UTC indicating the start time of the detection. This is typically in the format of yyyy-mm-dd HH:MM:SS.sss, which is a 4 digit year, two digit month & day, two digits for hours, minutes, and seconds (24 hour clock), and three digits for fractional seconds (down to milliseconds). I suspect the reason that this is showing differently in your screenshot is that Excel has mangled these, as it often does with dates and times.

UTCMilliseconds: This is a separate field containing just the fractional seconds of the UTC field from 0-999. This is needed because some databases and spreadsheet software truncate or do not correctly interpret date and timestamps that contain fractional seconds.

Amplitude: Without looking at the source code I can only speculate, but I would guess that the units are in dB and that they are RMS values calculated from the spectrogram, and most likely just the rectangle from start to duration and low to high frequency.

I certainly wouldn't recommend using these data for very much without further confirmation, but hope this at least provides a good starting point for further clarification.

$\endgroup$
3
  • 1
    $\begingroup$ I would still argue that the UTC timestamp in Excel is wrong and if it is correct in PAMGuard then the export function is wrong $\endgroup$
    – WMXZ
    Commented Jun 14, 2023 at 20:10
  • $\begingroup$ @WMXZ yes, it is quite possible that the export function or Excel has not correctly interpreted the timestamp. But, it could also be that the export function and timestamp data in Excel are indeed correct, and that Excel has just chosen to display on a portion of it, and has done so in some obscure format. $\endgroup$
    – Brian Miller
    Commented Jun 16, 2023 at 4:32
  • $\begingroup$ Thank you so much for the info! I changed the way that I opened the file in Excel (using the "Import Data" for a .csv specifically), and that seems to have fixed the date shifting issue $\endgroup$ Commented Jul 5, 2023 at 2:19
2
$\begingroup$

There are some Matlab and R based tools that enable you to work with Pamguard databases in a similar way to how you have extracted to Excel. The blog post from 2017 about the Matlab tools actually has a short description of the column headers:

Blog post The new Pamguard MATLAB library (scroll down to the section 'Using the MATLAB library').

Links to the tools hosted on GitHub:

PAMGuardMatlab

PamBinaries (R)

$\endgroup$
1
  • 1
    $\begingroup$ To extract features from Pamguard detections (click, whistle, burst pulse), I highly recommend the PAMpal package in R (available on CRAN) also here: [github.com/TaikiSan21/PAMpal][1] $\endgroup$
    – ASimonis
    Commented Jan 26 at 18:01
1
$\begingroup$

I hope PAMGuard developer or maintainer chime in, but here some partial answers

  • UTC timestamp makes (most likely) no sense as it only corresponds to local time in a very small part of the world. In the table UTC and local are effectively equal. So this is most likely a configuration/setup issue.
  • Having, as observed, varying timestamps for the same data, makes also no sense. Maybe again a configuration issue.
  • the start sample is certainly the sample (as measured from the beginning of the file) where the detected event begins. Proof: startSample/startSeconds is about 22100, which easily could be the sampling frequency
  • duration: the numbers make sense if duration of detected event is measured in samples
  • amplitude: they look to me if they are dB values but not clear if Peak or RMS values

I would agree, that tables alone are not easy to interpret

$\endgroup$

Your Answer

By clicking “Post Your Answer”, you agree to our terms of service and acknowledge you have read our privacy policy.

Not the answer you're looking for? Browse other questions tagged or ask your own question.