13
$\begingroup$

I have some ambient noise recordings and am uncertain if the lower SPLs represent true low noise levels in the environment, or are perhaps due to the noise floor of the instrument itself.

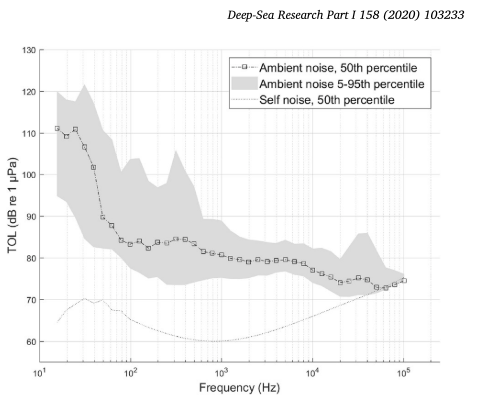
I have plotted the third octave levels of an ambient noise recording, but am noticing that the minimum sound pressure level values increase at high frequencies where I don't expect them to. I suspect that this is a reflection of the sensitivity of my instrument, rather than a true representation of ambient noise in the environment.

I have seen some examples in the literature (see attached) of plotting the "self noise" of an instrument on top of this, however I am uncertain how to get these values across the frequency range of my instrument. How do I determine what this self noise (or 'noise floor') is, so I can plot it atop mine too? I want to get this across the spectrum of the recording range of an acoustic monitoring instrument.

enter image description here

EDIT: Device is a SoundTrap, so I cannot disassemble the recording chain.
$\endgroup$
2
  • $\begingroup$ what does TOL stand for in the Y axis? $\endgroup$
    – Noil
    Commented Jun 30, 2022 at 22:01
  • 1
    $\begingroup$ Apologies, TOL = third octave level $\endgroup$
    – Chloe
    Commented Jul 1, 2022 at 7:26

3 Answers 3

4
$\begingroup$

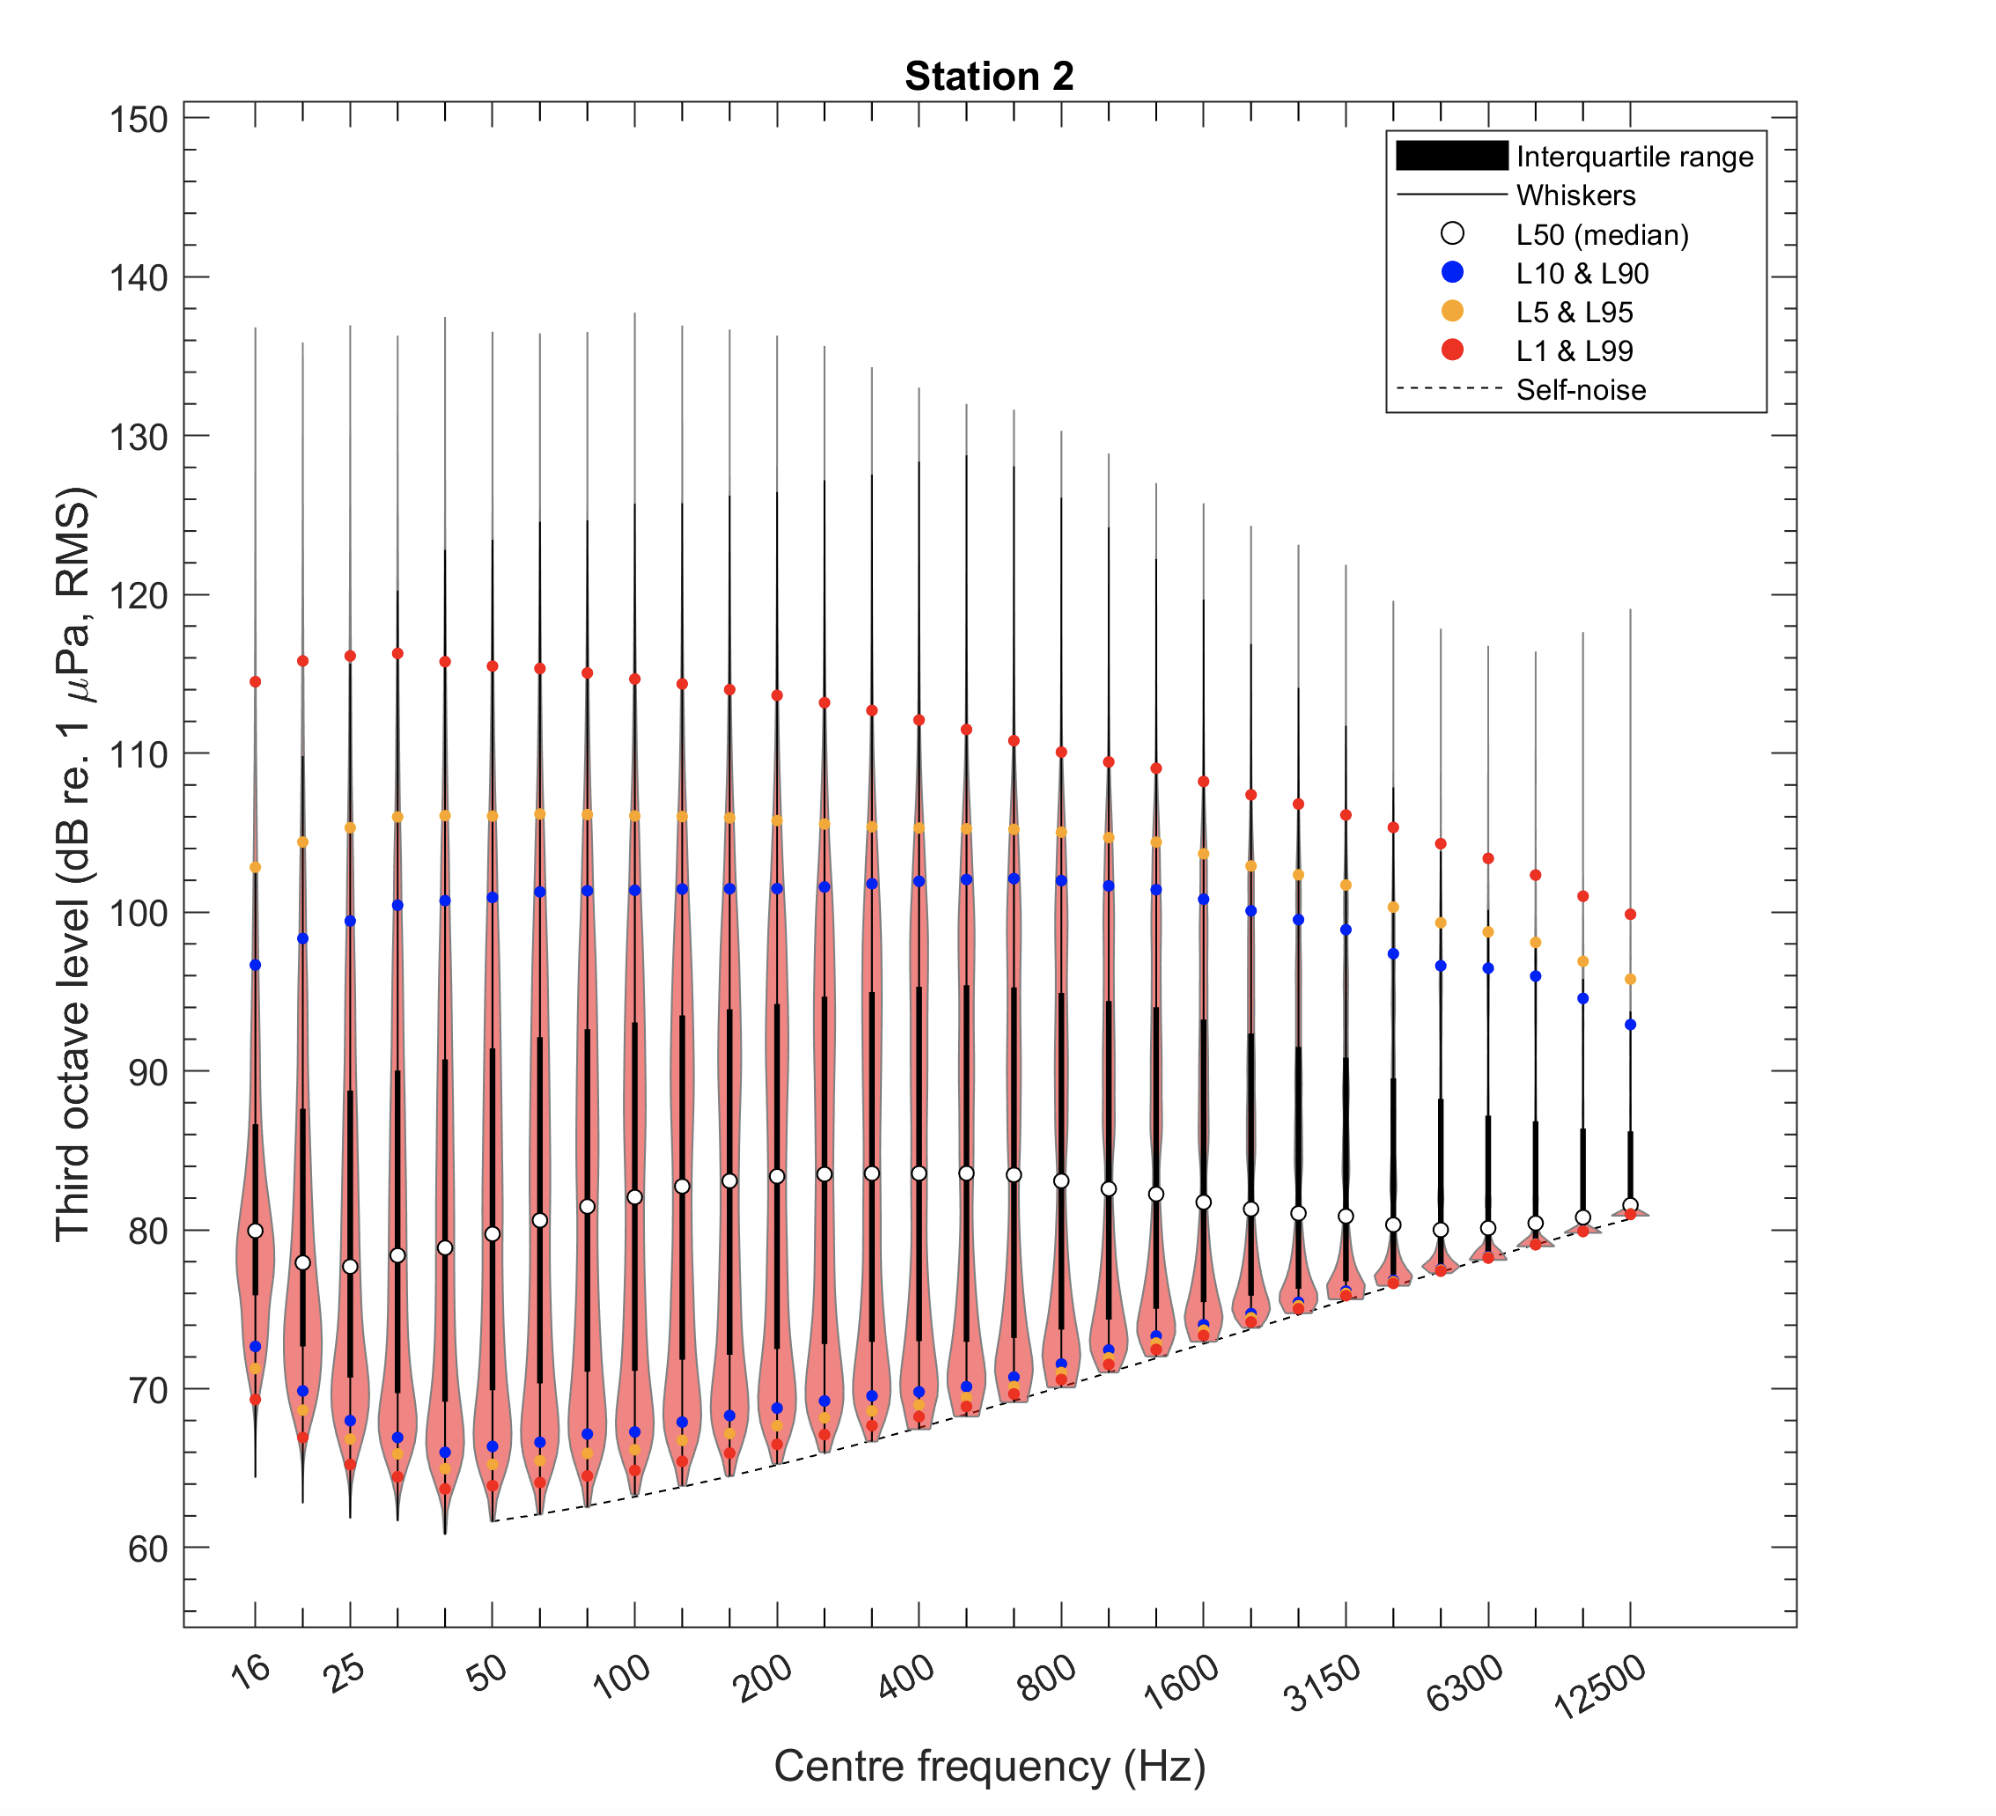
It's not the gold standard, but you can sometimes get a good idea of the self noise of an instrument by looking at the distribution of noise values. Take a look at this image from the supplementary material of;

Ladegaard, M., Macaulay, J., Simon, M. et al. Soundscape and ambient noise levels of the Arctic waters around Greenland. Sci Rep 11, 23360 (2021). https://doi.org/10.1038/s41598-021-02255-6

Violin plot of third octave noise levels. The thickness of each noise band measurement corresponds to the received distribution of noise levels. Coloured dots show the confidence intervals (see legend)

Long term noise measurements will usually form some sort of Gaussian like distribution - in this figure the noise values at lower frequency are higher amplitude and form the expected distribution. However, at higher frequencies the noise distributions begin to have a "hard edge" at the lower bound. This is almost certainly because the amplitude has fallen below the noise floor of the instrument (and so lower amplitude noise measurements are registered as the self noise of the instrument instead). Interpolating these lower bounds (dashed line) can provide an estimate of the noise floor of the instrument.

$\endgroup$
3
  • 1
    $\begingroup$ super helpful, thank you! $\endgroup$
    – Chloe
    Commented Jul 4, 2022 at 12:42
  • 1
    $\begingroup$ This is handy and what we end up doing too. If it's a hydrophone you can theoretically leave it in a quite place and set it going. Again, it won't be perfect but should get you in the ballpark. $\endgroup$ Commented Jul 5, 2022 at 0:04
  • $\begingroup$ Great, I guess it's worth re-emphasizing that this only works if you are in an environment where a significant portion of the distribution of noise values falls below the noise floor of the instrument. $\endgroup$
    – user213
    Commented Jul 5, 2022 at 7:25
4
$\begingroup$

I suggest you take the instrument that you used to make recordings in the wild, and make recordings in a quiet room, ideally one padded with foam - like those used for bat echolocation research - with the lights out (as lights have a hum that can contaminate your recordings). Then run your TOL analysis on this data, and plot whatever percentile of this atop the TOL percentiles of your ambient data. In the figure you attached, we can see that above ~30 kHz, the ambient noise recordings are limited by the self noise of the instrument. This means that above this frequency, your recording chain is not able to capture how quiet the environment is.

$\endgroup$
2
  • $\begingroup$ Strictly speaking, I understand that you are measuring the maximum of the ambient noise of the laboratory room and of the microphone+preamp selfnoise. For instance, in my lab soundproof chamber, the ambient lowfrequency level is very high (building fan system) and definetely higher than the selfnoise of some of my low-noise microphones. $\endgroup$
    – Noil
    Commented Jun 30, 2022 at 22:14
  • $\begingroup$ Agree @Noil, but I fail to see where I could readily obtain quieter ambient noise measurements $\endgroup$
    – Chloe
    Commented Jul 1, 2022 at 7:27
2
$\begingroup$

I would remove the micro/hydrophone and replace it with a small resistors. what you then measure is the thermal noise of the resistor.

If you change the resistor value, you can measure in addition to the electronic noise also the gain of the acquisition chain

The impact of the resistor R on the measured voltage V_out is

V_out^2=(e_n^2+i_n^2 * R^2 + 4 * k_B T * R) * G^2

where

e_n input noise voltage; i_n input noise current; G gain

For R=0 (short) we have V_0^2=(e_n^2 ) * G^2

which gives us an expression for Gain G

In the end we have a set of linear equations for e_n^2, i_n^2

e_n^2 ((V_out^2)/(V_0^2 )-1)-i_n^2 * R^2 = 4k_B T *R

At 20 C (293 K) we have :

4k_B T=0.016173 (nV^2)/(Ω*Hz)

Using at least 2 measurements with R>0 one obtains values for input noise voltage, input noise current, and gain

Edit: this gives self noise for whole acquisition chain.

Edit 2: The expression for 4k_B T is relative 1 Hz. What I typically do is not to measure the broadband noise voltage but the spectral density so may self noise estimates ate also relative to 1 Hz.

Edit 3: In practice, I record data having sensor (hydrophone in my case) replaced with different resistors and use MATLAB's pwelch function to get the PSD.

ceterum censeo: we need latex style math formula!

$\endgroup$
5
  • $\begingroup$ Could you confirm that this is for measuring the whole aquisition chain selfoise minus the microphone selfnoise? $\endgroup$
    – Noil
    Commented Jun 30, 2022 at 22:21
  • $\begingroup$ Yes, this is self noise of the whole analog chain, excluding microphone. I edited answer $\endgroup$
    – WMXZ
    Commented Jul 1, 2022 at 5:23
  • $\begingroup$ Thanks for this useful answer and walking me through it, @WMXZ. I should have specified that the instrument is a SoundTrap (Ocean Instruments), and so I cannot disassemble the recording chain. $\endgroup$
    – Chloe
    Commented Jul 1, 2022 at 7:29
  • $\begingroup$ For such systems you have to find an silent place. As most self noise is flat at higher frequencies, you only should avoid strong 50/60 Hz lines, that are picked up by hydrophone electronics and connection. $\endgroup$
    – WMXZ
    Commented Jul 1, 2022 at 15:25
  • $\begingroup$ Agreed, that is what I tried to do. $\endgroup$
    – Chloe
    Commented Jul 4, 2022 at 12:43

Your Answer

By clicking “Post Your Answer”, you agree to our terms of service and acknowledge you have read our privacy policy.

Not the answer you're looking for? Browse other questions tagged or ask your own question.