10
$\begingroup$

I have recorded animal calls in the wild, and I have lots of background noises (bird calls, cicadas etc.). Since my animal calls are quite low-pitched, I don't need the upper part of my spectrograms to conduct my acoustic analyses: I actually think that it can bias the results of my machine learning algorithm.

I have tried to remove all frequencies above 5KHz: Since I have a large dataset, I used batch filtering from Adobe Audition (Scientific Filter of Butterworth type) and Raven (Bandpass filter). For a few vocalizations, I do not manage to completely remove all upper frequencies (it seems to be the case for louder vocalizations, I think...).

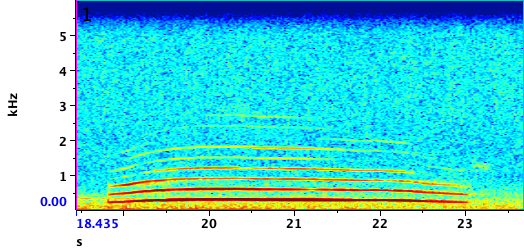
Here is an example with a loud call, this one: enter image description here

On the image below, we can see that, for the beginning of the call, the filter (batch bandpass from 0 to 5000 Hz with Raven) works quite well, but it does not in the loudest part: it leaves some harmonics in the middle section.

enter image description here

Do you know why I have this result? Do you know a software or technic that could help me to completely remove these frequencies?

Many thanks in advance!

EDIT: Thanks to Noil's comment, I realized that I have different results in Raven when I batch filter my folder of vocalizations or when I filter them one by one. Here is the same call as above, filtered with the same configurations (bandpass from 0 to 5000 Hz) but not in a batch process:

enter image description here

It's still not perfect, but way better... Any idea about why the Raven batch processing has weird results?

EDIT 2: I have an answer! The calls that were not correctly filtered were slightly clipped, which probably messed with the batch filter. I have thus removed them from the dataset.

$\endgroup$
6
  • $\begingroup$ I'd be interested to know what program you are using for the analysis? I use R and the functions I use to extract features (specan and mfcc_stats in the warlbeR package) allow you to set the frequency range you want. Otherwise in Raven you can use a bandpass filter to remove any frequency ranges you don't want. $\endgroup$
    – TomCLewis
    Commented Jun 23, 2022 at 18:08
  • 1
    $\begingroup$ thanks for the update edit - I'll reach out to Raven support (who have joined this site) and see if they can't give more insight $\endgroup$
    – selene
    Commented Jun 23, 2022 at 18:50
  • 1
    $\begingroup$ @potichien could you put in exactly what filter settings you used in Raven? $\endgroup$
    – selene
    Commented Jun 23, 2022 at 19:27
  • 1
    $\begingroup$ Spectrograms can be useful for quick checks - though I'm always a bit concerned as some programs have very large dynamic ranges (60-80 dB), that are set relative to the maximum 'pixel' value. This means, even after heavy filtering it may appear like the high-frequency content is still 'lingering' around, even though most of it is gone. Have you tried looking at the power spectrum of the signals before/after filtering to check if things are as expected? $\endgroup$
    – Thejasvi
    Commented Jun 23, 2022 at 21:37
  • $\begingroup$ Thank you very much @selene, I have edited the question! (I used a bandpass filter, from 0 to 5000 Hz) $\endgroup$
    – Potichien
    Commented Jun 24, 2022 at 13:06

3 Answers 3

6
$\begingroup$

As an alternative to actually filtering your data, have you considered just truncating your spectrograms? If your end goal is to feed this into a machine learning model, I think that this sounds like a lot of work just to give the model a dataset with a large region of "no data". It sounds like what you are hoping for is spectrograms that look similar to @B. Thomas' second image, but if that's the case then the entire blue region is not going to add any value to a machine learning model if all of your images have that same blue region. You should get equivalent results by just giving it spectrograms that all have been truncated at that same frequency value, since all the information in the image is below that frequency value. This also has the nice side effect of reducing the size of your dataset.

On the other hand, I think that by removing the harmonics from your spectrograms you are potentially losing a signal that a machine learning model could pick up on. You mention that you are worried about other signals in higher frequencies biasing your model results, but as long as your training dataset is large enough this shouldn't really be a problem. Unless you have a higher frequency sound that is consistently present with one type of call and consistently absent with other types of calls (which would be interesting to find out!) then it should all wash out as "noise" from the model's perspective.

$\endgroup$
5
  • 1
    $\begingroup$ Thanks for this! Truncating the spectogram is actually what I originally wanted to do but I could not find how to do it, either on Raven or Audition. Do you have a link to a tutorial or something that could help? I'll think about your comment on the harmonics, thank you for this $\endgroup$
    – Potichien
    Commented Jun 27, 2022 at 7:42
  • 1
    $\begingroup$ I'm not sure if you can do it in something like Raven or Audition, but it should be very easy to do in whatever programming language you are using for your machine learning model. You'll need to have the spectrograms as a matrix at some point (either by creating it from the waveform or reading it from an image), so you can just subset that matrix for only the rows with frequencies you are interested in $\endgroup$ Commented Jun 28, 2022 at 0:07
  • $\begingroup$ Your answer could be improved with additional supporting information. Please edit to add further details, such as citations or documentation, so that others can confirm that your answer is correct. You can find more information on how to write good answers in the help center. $\endgroup$
    – Community Bot
    Commented Jun 30, 2022 at 14:41
  • $\begingroup$ what about down-sampling the recordings to 10 kHz? This would automatically make spectrograms that are truncated to 5 kHz... would that be a solution and if not, why? $\endgroup$
    – lframond
    Commented Oct 17, 2022 at 6:59
  • $\begingroup$ @lframond yes, that can also work but you need to make sure you apply the appropriate filter before downsampling to make sure your results do not have any aliasing. Just adds extra processing steps $\endgroup$ Commented Nov 1, 2022 at 19:02
8
$\begingroup$

To remove the content above a given frequency, you should use a "low-pass filter".

From your spectrogram, it seems that you applied a low-pass filter on the first part of the signal only. Are you sure you selected the whole signal before applying the filter?

The filtering process just removes a given amount of energy (e.g. -3 dB or -3 dB per octave) on a particular frequency band (in your case above a given frequency). Then applying 1 filter might not be enough for the application you require. You can reiterate the filtering until you have reached the amount of filtered energy that suits you.


EDIT: The last spectrogram you added (after you edited your question) looks good to me.

  • Don't forget that the color scale is in dB and depends on the default range mapping: it can look like there are still a good amount of energy (i.e. bright color) while it can actually be negligible for your application.
  • Especially, the vertical yellow band that remains in your higher frequency range are not likely an artifact of the filtering, it just means that the energy was initially greater there than in the background. These vertical bands still look far less loud than your low-frequency range; but check the color scale.
$\endgroup$
2
  • $\begingroup$ Thank you for this! Interestingly, you are right, it seems that the batch filtering only worked on the beginning of the call. I have updated the question to add more details! $\endgroup$
    – Potichien
    Commented Jun 23, 2022 at 16:41
  • 1
    $\begingroup$ You new spectrogram looks good to me now! See the added paragraph in my response. $\endgroup$
    – Noil
    Commented Jun 24, 2022 at 9:16
8
$\begingroup$

The bandpass filter in Raven uses a Kaiser Window FIR filter, which has a very high stop band attenuation (100dB), and a very rapid transition from pass-band to stop-band. This is very good for completely removing certain frequencies.

A Butterworth filter can usually be configured with an order, the higher the order, the more attenuation you will get. If the order is not configurable, as @Noil mentioned you can repeat the filter operation until you get the desired attenuation.

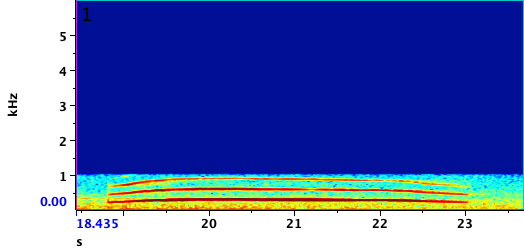
A bandpass filter can be used as a lowpass if the lower limit is 0 Hz. I'm not familiar with Audition, but in Raven using a bandpass filter usually gives you something like this:

Original signal:

original signal

And with a bandpass with a high limit of 1kHz:filtered

$\endgroup$
1
  • $\begingroup$ Clear answer on the effect of steep filtering. As mentioned in previous comments/answers - could you double check that the spectrogram color bar has the same mapping (e.g. set the color bar manually or to be fixed to a particular range of values?) $\endgroup$
    – Thejasvi
    Commented Jun 27, 2022 at 12:42

Your Answer

By clicking “Post Your Answer”, you agree to our terms of service and acknowledge you have read our privacy policy.

Not the answer you're looking for? Browse other questions tagged or ask your own question.