2
$\begingroup$

I am using 120 x one hour acoustic files ( according to "Guidelines for the use of acoustic indices in environmental research, https://doi.org/10.1111/2041-210X.13254) to describe my soundscapes using the maad.util.plot_features in python. This means I take the hourly average for my indices (ACI, NDSI, BI, Hf, ADI, AEI) over a day. Additionally I plot the mean spl in each 1000 Hz frequency domain from 0-22000 kHz, for each hour over a day, with

Can this method represent some characteristics (i.e the variations of selected indices ACI, NDSI, BI, Hf, ADI, AEI) for a day, by simply taking their mean value?

yes I described it wrong, what I actually wanted to say and what I actually do is that I use 120 hours (not minutes), or about 5 days of one minute continuous recordings (=5x24hr=120hr=7200min).

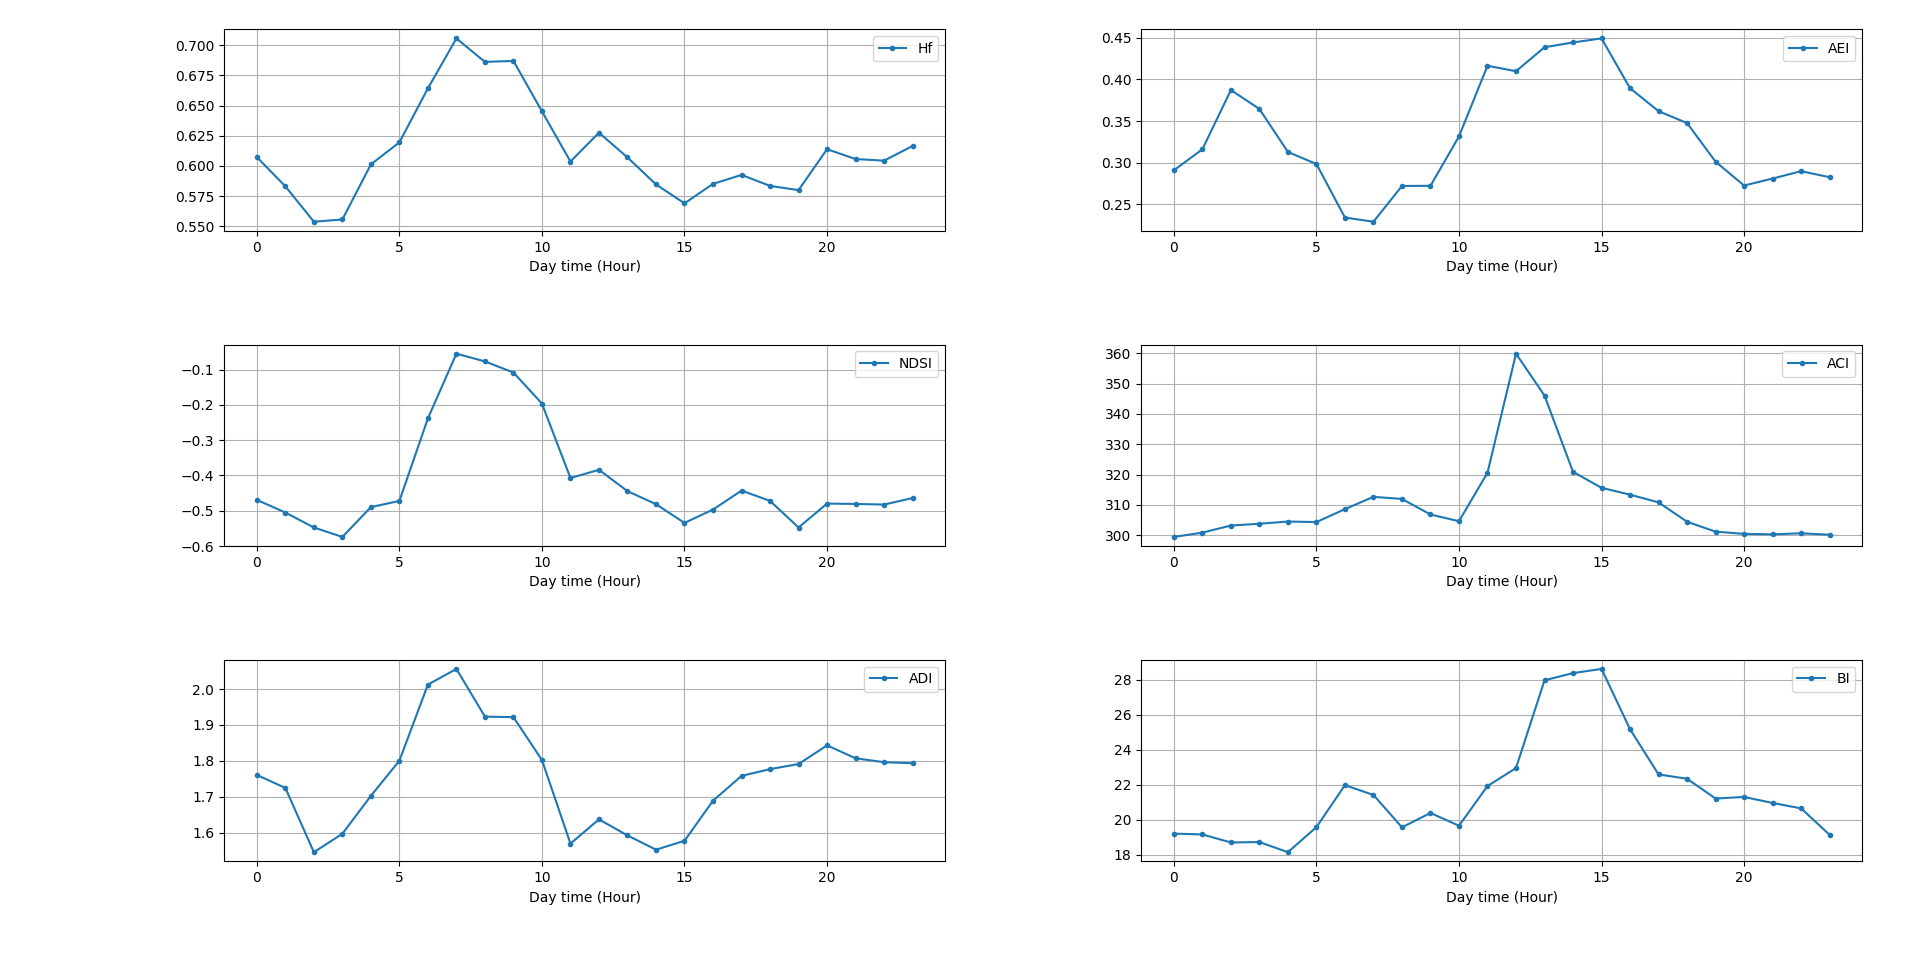
In order to find a motive of the daily sound variations of a soundscape , and describe it in a general way (in my case mixed cupressus/pine forests ) I resample the calculated indices on a daily average for every hour. This means the average hourly rate from all five days on a 24hr graph (I post a relevant graph). My question is if this method is sufficient or if there is another suggested methodology.

Regards,

enter image description here

Daily average of selected indices from 7200 minutes recording
$\endgroup$

2 Answers 2

3
$\begingroup$

The short answer is 'yes', you can use those indices and that workflow to characterise the soundscapes at each site. Whether 120 hours is suitable for your sites will depend on the complexity of the soundscapes. 120 hours is an arbitrary threshold, but one which is probably reasonable in most cases. I have tested decline in variance of the standard error with a range of datasets, and it always follows the same shape but is sometimes quicker than 120 hours to reach ~10%.

In terms of whether a single mean value is appropriate for a whole day, I would recommend looking at Yoh et al (2024) https://doi.org/10.1111/2041-210X.14361 - see their Figure 4 which shows the effects of binning acoustic data at differing levels of temporal resolution.

However, perhaps even more importantly, I would urge you to think about which are the best indices to use, and what the patterns might be telling you about the soundscape. Full disclosure: I am the first author on the paper linked in the original question. Other work that I and colleagues have published in the last couple of years is intended to help decide which indices might be most appropriate for your use case, and what the patterns might mean. See https://doi.org/10.1111/2041-210X.14194 and https://doi.org/10.1111/2041-210X.14357.

$\endgroup$
1
  • $\begingroup$ Thank you Tom, best regards $\endgroup$
    – xrigeo
    Commented Oct 8 at 12:19
0
$\begingroup$

This is really outside my expertise, and I'm not sure I fully understand your question. But in an effort to learn more, I took the time to read the abstract of the linked article, and already I would venture to say that what you say you're proposing is not in accord with the recommendations of the paper that you've linked.

The article abstract suggests that 120 hours of continuous recording are needed to reliably characterise the soundscape of a site (with further caveats about types of sites they looked at: namely "a range of habitats in a human-modified tropical landscape in central Panama").

120 x one minute acoustic files is 1/60th of the recommended quantity of data, and it seems that one of the main points of the authors of the linked article is that larger datasets made a difference for their study.

Perhaps if you posted more detailed description of what you've tried, details of your results, and a clearer question, you might find the community here more likely to provide a potentially more helpful response.

$\endgroup$

Your Answer

By clicking “Post Your Answer”, you agree to our terms of service and acknowledge you have read our privacy policy.

Not the answer you're looking for? Browse other questions tagged or ask your own question.